DYU group makes market research at the beginning of the year and here is the final report. It will inspire and help the partners and friends of DYU, and help you make better decisions in the electric bike field.
Overseas Market Overview
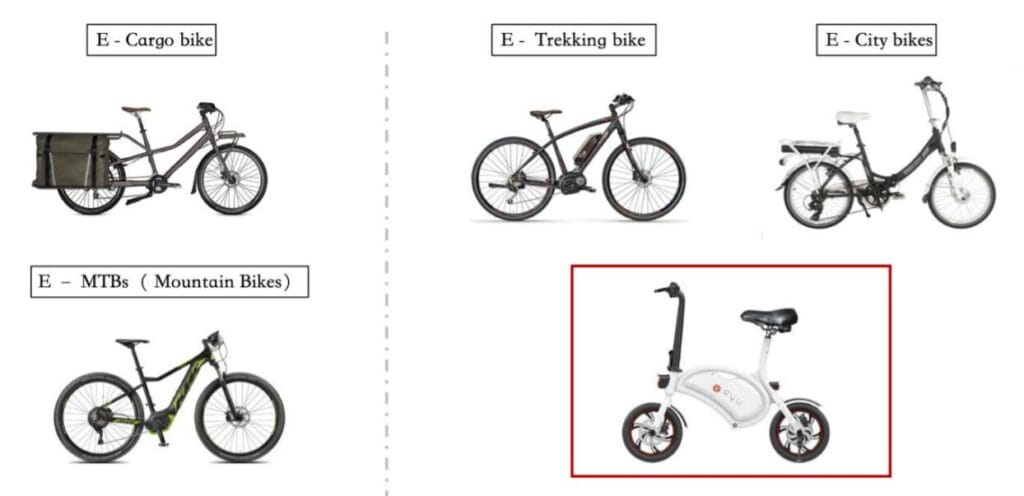
- E-bike is called as E-Cargo bike, E-Trekking bike, E-MTBs and E- City bikes in Europe. According to Germany
Zweirad-Industrie-Verband (ZIV) Association data, 2017 E-bike sales in Germany, E – city bike (city electric bike)
And E – Trekking bike (traveling electric bicycles) accounted for 74%, and the proportion increased year by year. And 99% of E-bike symbols sold in Germany are
in accordance with EN 15194. Its maximum power does not exceed 250w and the speed does not exceed 25 km/h. - The DYU series belongs to the E-City bike and E- Trekking bike in the E-bike abroad. Compared to the traditional E-bike, the DYU is redefining the righteous product form. It’s more fashionable with technological sense.
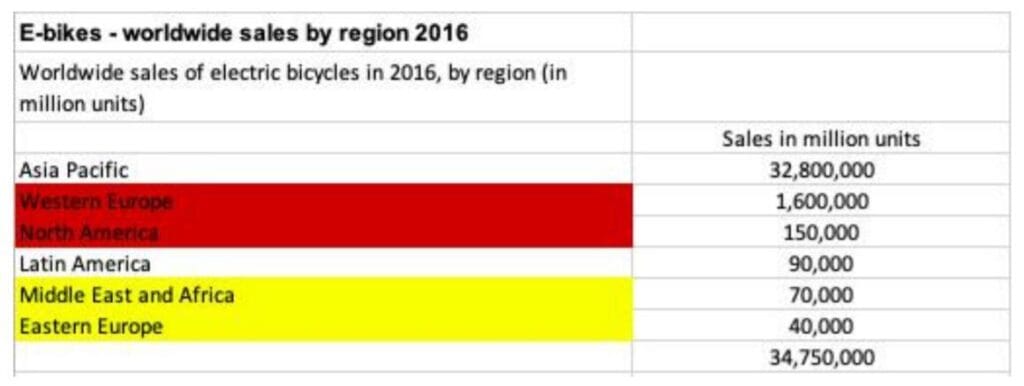
Market Size: Rapid growth period: 2016-2020; Stable period: after 2020
- According to Statista data, in 2016 global E-bike sales, Asia Pacific accounted for the largest shares, and the Chinese market is the largest…
- The sales volume of some overseas markets in 2018, 2019 and 2020 will be forecasted in the next three years.
- Over markets: East Asia (Korea), Europe (Germany, Netherlands, Italy, France), North America (USA), hereinafter referred to as overseas partial markets;
- According to Statista data, Germany, the Netherlands, France and Italy accounted for more than 68% of E-bike sales in 2016.
Conservative estimates of European market size.
- Benefiting from the rapid development of the market, the friendliness between overseas governments and E-bike has maintained a neutral growth rate in the same period. By 2020, China will be able to maintain a neutral growth rate.
- External market: East Asia (Japan, Korea), Europe (Germany, Netherlands, Italy, France), North America (United States);
- – Conservative estimates (excluding Southeast Asian markets) of 4.01 million vehicles sold in some overseas markets in 2020, including E-city bike, where DYU is located.
- The market for bike and E-trekking bike is about 3.21 million vehicles with a market size of $2.6 billion. DYU is expected to occupy 10% of the whole industry by 2020. 10% of the market share and 280,000 vehicles can be shipped worldwide by DYU group.
- (Excluding Southeast Asia, the market is all lightweight electric bicycles, i.e. less than 250W power and less than 25KM/h) Considering Southeast Asia in the next five years
- With the rapid development of the market, the actual sales volume will be much higher than expected.
- Stable period (after 2020): the growth rate of the market scale has declined and the transition has remained stable. There are great differences among different regions in foreign markets, and market development has existed successively.
- Time lag. According to the data, the European market develops fastest and the Southeast Asian market has the greatest potential. After 2020, more attention will be paid to the refined operation of the market.
- DYU plans to increase market share to more than 20%.

Regional Difference Analysis
Europe
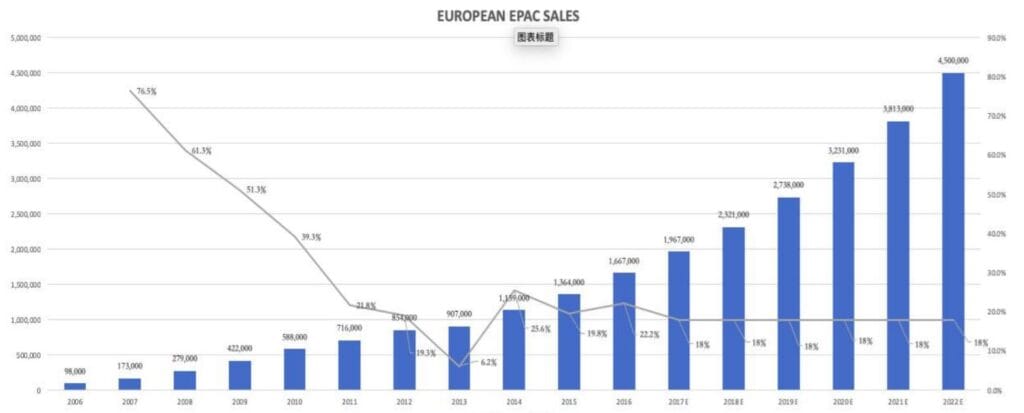
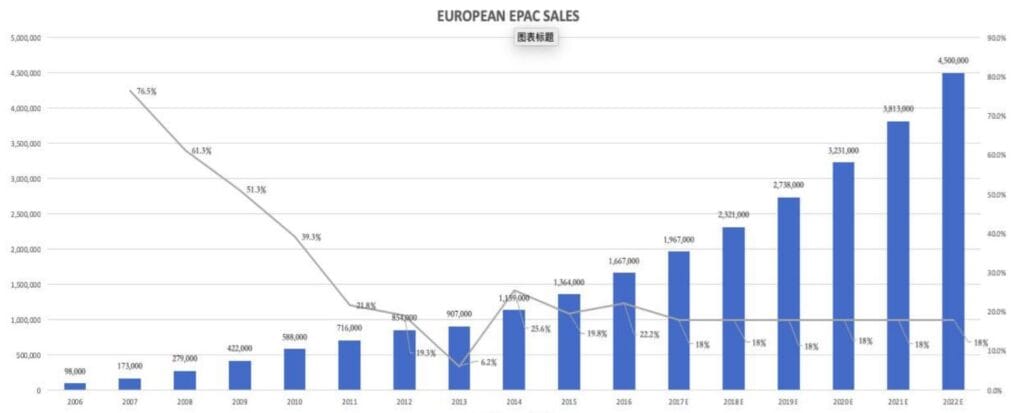
Sales in Europe in 2014, 2015 and 2016 were 1.13 million, 1.36 million and 1.66 million respectively, with growth rates of 25.6%, 19.8%, 22.2% respectively.
According to Technavio’s forecast, the average annual growth rate of E-bike sales in the European market is 18% from 2017 to 2022, or 4.5 million E-Bike in the European Market
Market Basics
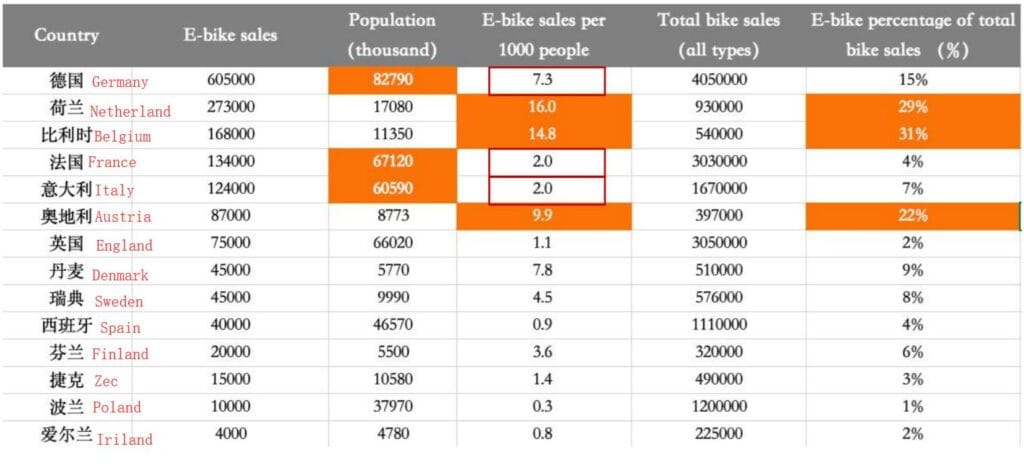
According to the annual report of the CONEBI Association in 2016, the top three occupancies of E-bike per 1000 people are the Netherlands, Belgium and Austria, while the top three occupies total sales are Belgium, the Netherlands and Austria. In terms of population, sales and per capita share, the future market of France, Germany and Italy has greater room for growth.
Market Features
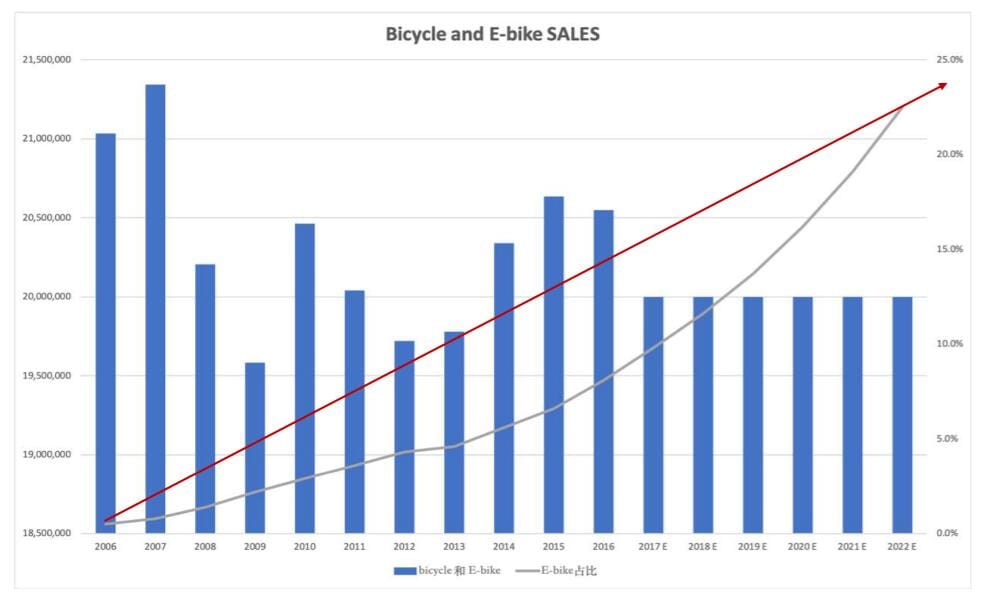
- Consumers have a high acceptance of lithium vehicles and a strong consumer capacity. The average price of E-bike in Europe is 1,000 euros; Demand side. The European market has a strong bicycle travel base. Bicycle and E-bike sales have stabilized at more than 2 million vehicles in the past 10 years. On the supply side, bicycle and E-bike in the European market produce more than 12 million vehicles, of which at least 8 million are imported annually. E-bike sales have increased rapidly over the past three years.
- EU members have reached a consensus that they are committed to energy conversion in the transport sector, namely “oil to electricity”, promoting clean energy and promoting the development of lithium-ion travel industry.
- Affected by the cold current, the seasonal variation of market demand is greater, and the sales volume in the first half of the year accounts for more than 50%.
The traditional bicycle market in Europe is in a mature period, with annual output and sales stable for a long time. Bicycle and E-bike sales in the European market fluctuate from 20 million to 20 million, while the share of E-bike is growing rapidly. In 2016, E-bike sales accounted for 8%. Due to the consumption concept and product appearance and function, more demand is shifting from traditional bicycles to E-bike. In the future, E-bike sales will increase rapidly. – The proportion of bike will continue to increase. It is expected that by 2022, the sales of E-bike will reach 4.5 million units, accounting for 22%.
Driving Factors
EU Policy Consensus:
The European Commission is committed to reducing carbon emissions in transportation by 60% by 2050, and the elimination of fuel vehicles will further promote smaller, lighter and more environmentally friendly means of travel, such as bicycles and electric bicycles.
Substitution of travel demand:
Substitution of travel demand:
European market travel demand distance is relatively short, 0-5km is mainly bicycle, 5-15km commuting demand is mainly automobile. At present, 75% of travel distances in Germany are within 10 km, 66% of Dutch commuters are within 15 km, and the average working distance is 12 km. Because of “oil to electricity”, traffic congestion, and green travel awareness, as well as the ever-growing appearance design and riding comfort of electric bicycles, this part of travel distance needs will gradually transition to electric bicycles in the future.

Germany
The sales of electric bicycles in 2015, 2016, 2017 and 2018 were 530,000, 600,000, 720,000 and 850,000 respectively, with growth rates of 13%, 19% and 18% respectively. According to the Federal Bureau of Statistics, the share of imported electric bicycles was 25% in the first half of 2018.
Driving Factors:
1. In 2001, the German Federal Government implemented the “National Cycling plan” in 2020, the government financially supports and promotes bicycle travel with an annual budget of 3.2 million euros.
2. In May 2017, Germany introduced a new road traffic safety law StVZO, which revised the requirements of bicycles and electric bicycles. Bicycles and electric bicycles with speeds of no more than 25 km/h are grouped into one category, which adds more lighting functions to bicycles.
3. In August 2016, the Federal Government implemented the Federal Transport Infrastructure Plan 2030, which is to promote itself as part of the modern transport system through the National Radverkehrsplan document. The Government plans to invest 100 million euros annually.
4. At present, the stock of bicycles in Germany is as high as 73 million. More than 80% of German households own at least one bicycle. The cycle of bicycle replacement is long. According to ZIV data, more than 2.5 million electric bicycles are currently traveling on German roads. Consumers’ willingness to buy E-bike has been steadily increasing.
Netherlands
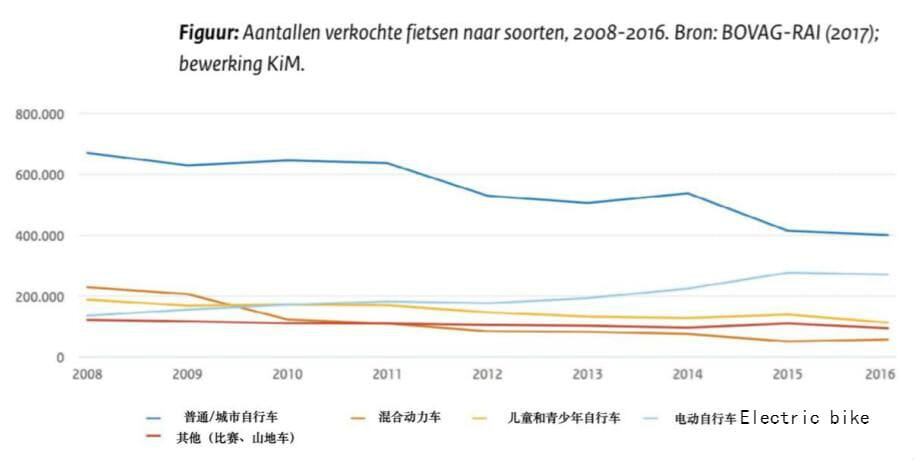
From 2008 to 2016, sales of Dutch traditional bicycles have been declining, while sales of electric bicycles have been rising since 2012.
Market size:
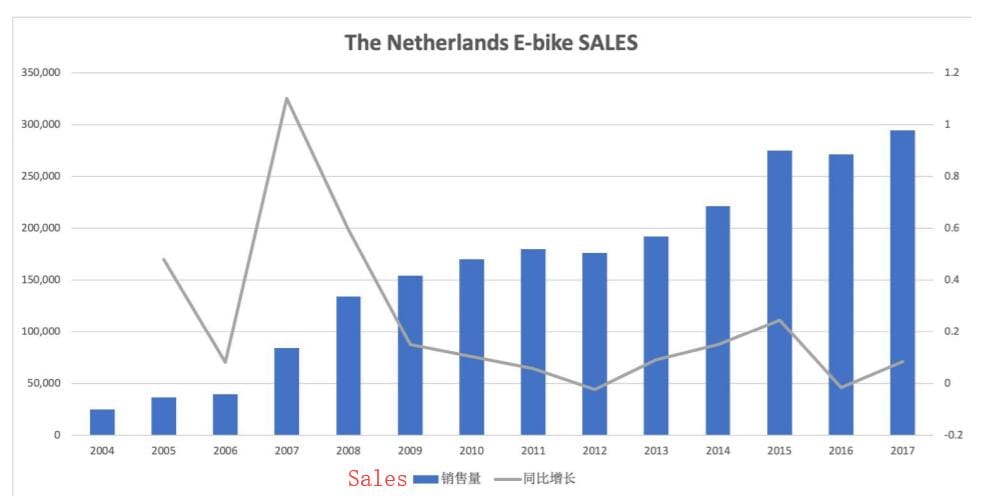
The Netherlands has a population of 17 million and more than 20 million bicycles, of which 2 million are electric bicycles. The sales of electric bicycles in the Netherlands in 2015, 2016 and 2017 are 275,000, 271,000 and 294,000 respectively, with steady growth.
- Consumer population is younger: but the trend from 2013 to 2016 is that cyclists are younger gradually, but still mainly 65 + age.
- Demand changing: The proportion of electric bicycles used for daily travel and work has increased significantly.
- The RAI and Fietsersbond associations plan to propose to the government that fast bicycle lanes and bicycle lanes be used as electric bicycle driving roads.

Driving Factors:
66% of Dutch people commute within 15 kilometers and 7.5 kilometers, most of them choose bicycle travel, 7.5 kilometers to 15 kilometers. At present, they are the main drivers of car travel. In addition, the commuting distance does not exceed 20 kilometers, and 43% of travelers will choose bicycle instead. Electric bicycle extends the distance of bicycle travel, and will become a substitute for the demand of automobile travel within 15km in the future.
France
The sales volume of E-bike in 2015, 2016 and 2017 were 102,000, 134,000 and 200,000 respectively, with growth rates of 32%, 31% and 49%, respectively. The average selling price was 1,500 euros.
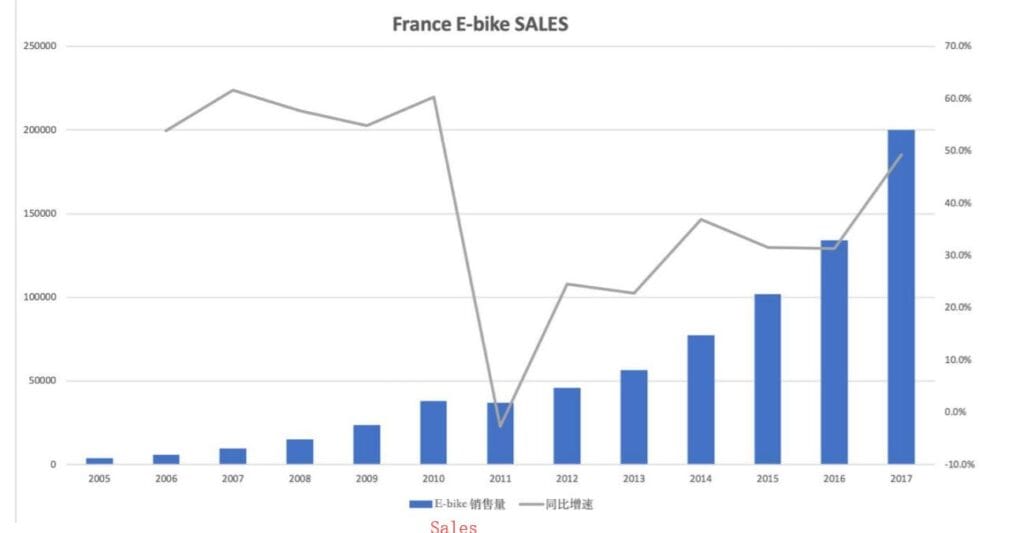
France has a good bicycle infrastructure. In the past, the sales of E-bike in France grew rapidly, with a growth rate of 49% in 2017. As the first in Europe, E-bike will gradually replace the traditional bicycle as a new way of city travel in the future.
01. On February 16, 2017, the French government subsidy EPAC (electric pedal) which meets the requirements.
By January 31, 2018, a policy subsidy of 200 euros will be granted.
02. On September 4, 2018, the French Government promulgated the PLAN VELO & MOBILITES ACTIVES Act, also known as the Liquidity Assistance Act, which raised the proportion of bicycle riding in France from 3% at present to 9% in 2024, and invested 350 million euros in the next seven years to fund bicycle infrastructure construction, as well as to build bridges and special passages at highways, ring roads and railway crossings. For the smooth passage of bicycles.
03. By contributing bicycles to the commuting expenses of its employees, a tax credit of up to 400 euros can be obtained. At the same time, the cost of setting up bicycle Fleets for employees will be deducted from the company tax in 2019.
USA
The U.S. E-bike sales in 2014, 2015 and 2016 were 193,000, 130,000 and 152,000 respectively, with growth rates of 21.4%, 32.6% and 16.9%, while the U.S. market sales in 2017 were 263,000. Among them, about 215,000 vehicles were imported, 15,000 were produced locally in the United States, and the proportion of imports was 81.7%.
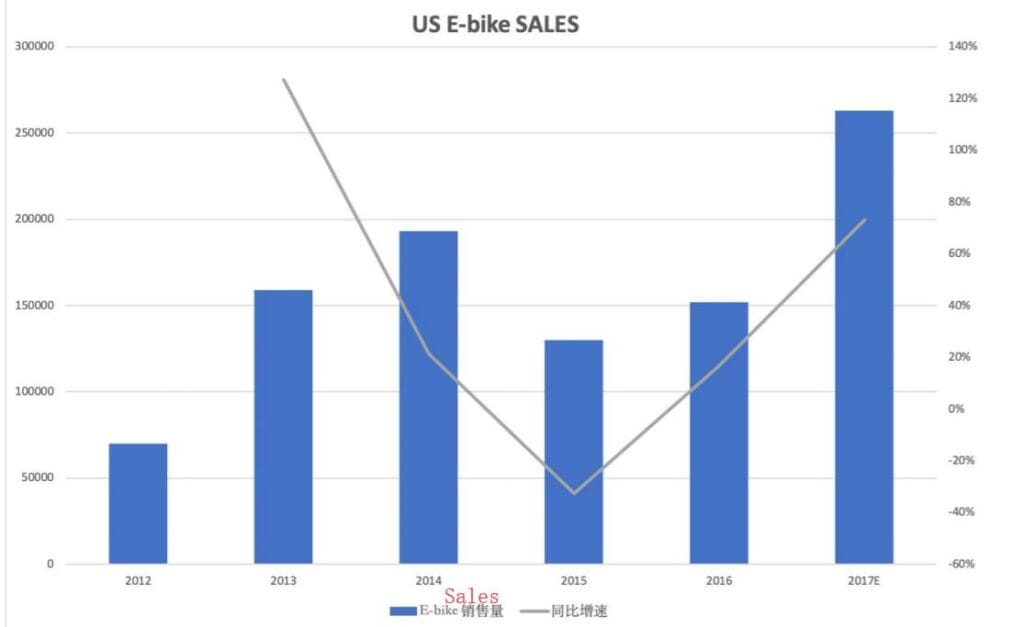
- The United States lacks the industrial chain foundation and relies heavily on imports. Since globalization, with the rise of human costs, the bicycle industry chain in the United States has concentrated on China and Taiwan. Almost all American electric bicycle dealers have imported from abroad.
- Trade War Tariffs, Increasing the Cost and Price of Terminal Products: For 18 years, Trump Government has imposed a 25% tariff on imports of electric bicycles and accessories from China, while the United States does not have a corresponding industrial base. Supply chains for motors, batteries and other accessories need to be imported from China.
- Differences in consumption concepts: For Europe, most regions believe that any type of bicycle is a means of transport, the corresponding cultural basis, the rapid growth of the electric bicycle market. American consumers believe that bicycle is a tool for sports, fitness and entertainment, and the way of transportation is car.
- The impact of shared scooters:Shared electric scooters grew rapidly in 2018, with Lime and Bird valued at more than $1 billion, while Uber, Lyft and major automobile manufacturers launched their own electric scooter services, which had a certain impact on short-distance travel demand.
Consumer Behavior:
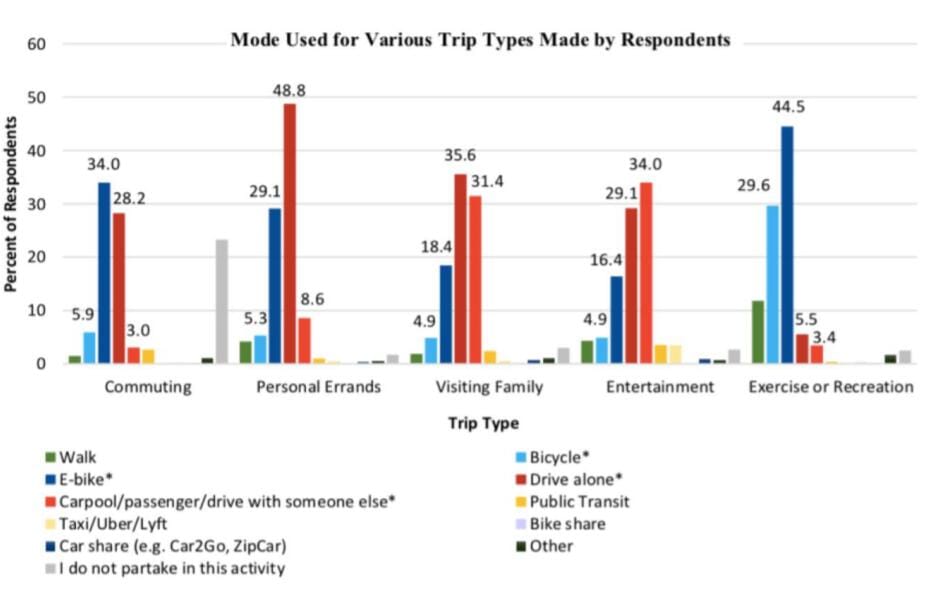
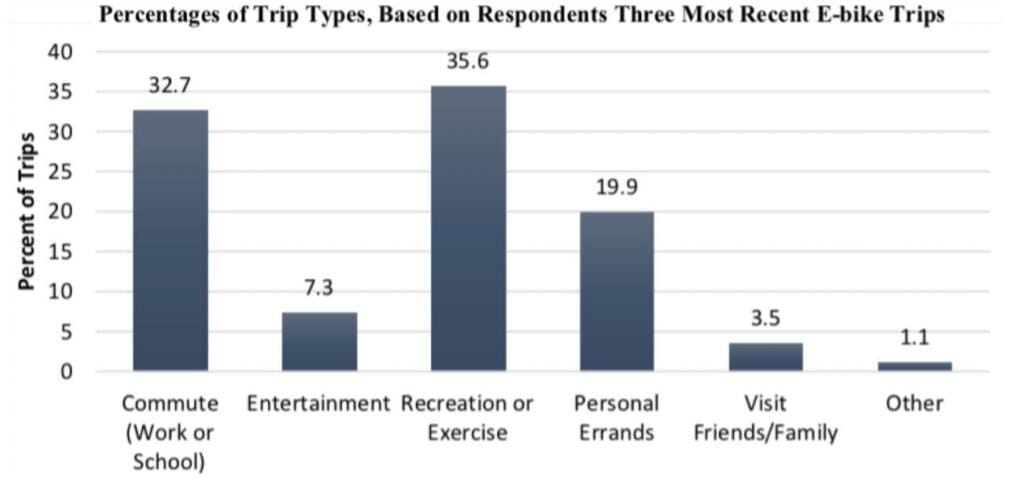
- In the United States, E-bike is more popular with male users. Male users account for about 2/3 of the total group, while in Europe, the ratio of male to female is 1:1.
- Commuting and Exercise and Recreation are the first choices, accounting for 34% and 44.5% respectively, while E-bike is regarded as the second alternative to automobiles in terms of travel demand.
- The first three scenarios for E-bike users are Recreation or Exercise, Work, Commute and Personal Errands, which are 35.6%, 32.7% and 19.9% respectively.
Southeast Asia and India
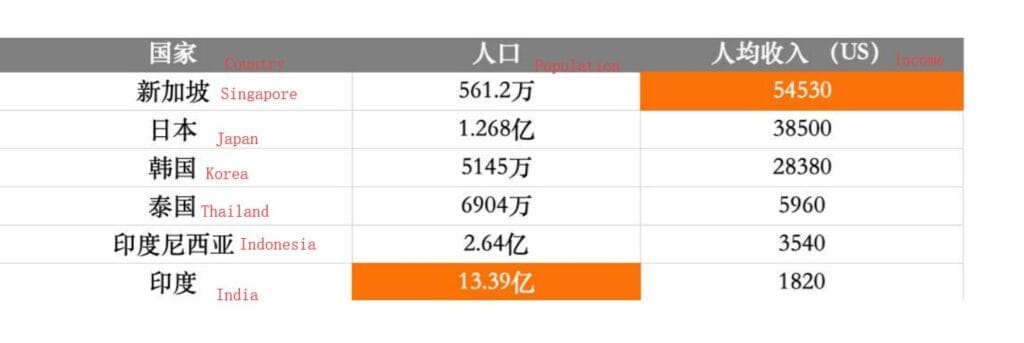
Singapore has the highest per capita income and India has the highest population
Singapore
Market Basics:
- With the supervision of the Singapore government on bicycle sharing, obike announced its withdrawal from the Singapore market in June 18th. At present, the Singapore market is in the travel market.
- The largest sales volume is E-scooter. It is expected that Singapore’s travel market will continue to be dominated by E-scooter in the future, with steady growth in sales.
Driving factors: Policy Leading
- Starting in 2015, the more stringent the Singapore government’s regulation of power-assisted bicycles / E-bike policy is, the more orange is needed.
- On the one hand, the label certification is more strict, and on the other hand, consumers consider the complicated procedures and travel regulations. Businessmen and consumers will focus on electric sliding.
- E-scooter, sales are growing rapidly.
- In December 2015, the Land Transport Authority (LTA) of Singapore stipulated that electric bicycles should not exceed 25 kilometers per hour without accelerator pedals.
- In February 2016, LTA stipulated that electric bicycles must be labeled with an orange certification label, which meets the European EN15194 standard, i.e. weighing less than 20 kg and speeding less than 25 km/h.
- In August 2017, LTA announced the registration system for electric bicycles. The owners of electric bicycles are over 16 years old. The registration and the transfer of license plates are subject to payment. The owners of electric bicycles must complete the registration by January 31, 19.
- At the end of 2018, the Singapore Land Transport Bureau announced UL2272 certification for Personal Mobility Devices (PMDs), i.e. E-scooter. After January 1, 2021, all PMDs on highways conform to UL2272 certification. From July 1, 2019, the sale of E scooter without UL2272 certification is prohibited, and a two-year transition period for non-compliance is set up until December 2020. At the same time, e-scooters are registered, requiring registered owners to be over 16 years old and to be registered from January 2, 19.
Thailand
Market Basics:
- Thailand has a population of 69.04 million and a per capita income of 5,960 US dollars, which is relatively high in Southeast Asian countries. But the current market
- Still, mopeds and electric motorcycles are the main ones.
- Poor infrastructure construction, low per capita income, the current market is still dominated by mopeds and large electric vehicles, consumers need
- Mainly consider continuity, power and manned.
- Electricity is expensive, motorcycles are mainly gasoline, and the price is relatively low.
- In subtropical climate, high temperature, high wear rate of electric wheel tires
The Republic of Korea
Market Basics:
- Korea’s E-bike sales in 2015 and 2016 were 17,000 and 20,000 respectively. The growth rate has maintained relatively stable growth.
- Compared with the annual sales of 2.4 million bicycles, electric bicycles are pushing slowly in Korea. Previously, electric bicycles were equated with motorcycles as “motor vehicles”, which required a driver’s license and were restricted to driving in motor lanes.
- In March 2017, the new Law on the Development of Electric Bicycles stipulated that electric bicycles with speeds less than 25KM/h and weights less than 30kg belong to non-motorized vehicles and can ride on bicycle paths, and anyone over the age of 13 can ride.
Driving factors:
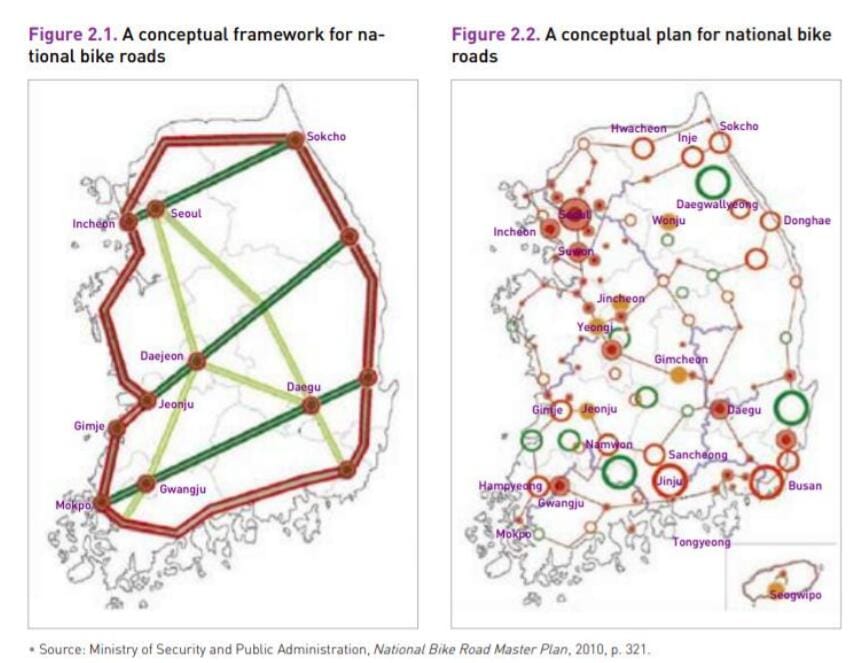
- Beginning in 2009, in order to achieve carbon, the Korean government has successively implemented the Master Plan for National Bike Roads, Four-River Bike Paths and New Town Bicycle Project to build bicycle track infrastructure. Among them, the National Bicycle Plan has a budget of 2.35 billion won and a construction of 4835 kilometers of bicycle lanes. Vigorously promote bicycle travel to alleviate urban traffic pressure and reduce carbon emissions.
- In March 2017, in order to promote electric bicycles, the government passed the new Law on the Development of Electric Bicycles in Congress. From March 2018, electric bicycles with speeds below 25KM/h and weights less than 30kg belong to non-motorized bicycles. They can ride on bicycle paths and anyone over the age of 13 can ride.
Future Trends
The lithium-electric industry in Korea is the world leader, and the bicycle industry is developed, which has great advantages in terms of industrial development.
70% of the country’s land belongs to mountainous and hilly areas, and the demand for torque power is weak. The bicycle infrastructure in Korea has been completed.
After March 18, portable electric bicycles can be used in the form of bicycle lanes, along with people’s awareness of low-carbon environmental protection.
* The Korean market will shift from mopeds to lithium-ion light electric bicycles in the future.
India
Market Basics
Motorcycles dominate most of the market, while electric motorcycles and cars are relatively small: total sales of two-wheeled vehicles in India in 2017 were about $11.6 billion, more than 99% of which were mopeds. According to Tianfeng Securities research data, the top five brands of two-wheeled vehicles in India in 2017 were Hero Moto, Honda, Bajaj, TVS Motors and Yamaha, with sales of 6.76 million, 5 million, 3.75 million, 2.92 million and 780,000.
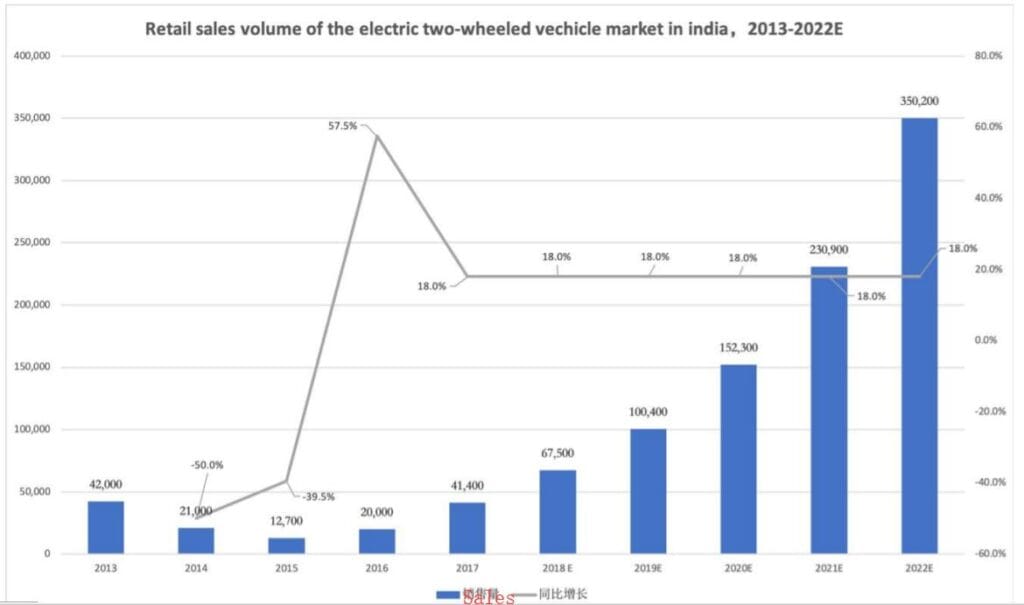
According to SIAM data, India has sold 450,000 electric bicycles in the past eight years, compared with 41,000 in 2017. Hero Electric currently accounts for nearly 70% of India’s electric vehicle market share.
Driving factors:
- Policy: In 2015, the Indian government introduced Faster Adoption and Manufacturing of Hybrid and Electric Vehicles, or FAME, to provide financial subsidies for hybrid and electric technology vehicles, including two-wheeled vehicles. Sales of electric two-wheeled vehicles have begun to rise, reaching 414,000 in 2017 and $17.5 million in the same year.
- For example, FAME gives a financial subsidy of $26 to $422 for bicycles or motorcycles powered by different types of batteries.
- Technology: India’s power battery industry is small and dominated by lead-acid batteries. The lithium industry chain has not yet been established, and the lithium cores are totally dependent on imports, mostly from China, South Korea, Vietnam and other countries. At present, India’s Reliance Industries, Indian Oil, Exicom Industries and other manufacturing, energy and telecommunications industries have announced their lithium production plans. Suzuki and Toshiba have jointly invested in the construction of lithium-ion and PACK plants in Gujarat State. Local production of lithium-ion industry will further reduce the manufacturing cost of electric bicycles.
Future Trends
- The first two-wheeled vehicle is the electric bicycle. In 2017, the sales of electric bicycles in India exceeded the sales of electric vehicles. From the perspective of scale effect, the government will promote the development of battery industry and stimulate the primary demand through fiscal policy, but the development of electric vehicles is not as good as expected, and the two-wheeled vehicle will take the lead in realizing the electric bicycle.
- With the popularization of lithium battery electric bicycle, its performance is gradually approaching the traditional motorcycle, and its cost is further reduced. At the same time, in the government.
- On the basis of subsidies, the electric vehicle market in India will grow rapidly.
Date Source and Translation from:
Global Ebike Trends
https://trends.google.com/trends/embed/explore/TIMESERIES?req=%7B%22comparisonItem%22%3A%5B%7B%22keyword%22%3A%22ebike%22%2C%22geo%22%3A%22%22%2C%22time%22%3A%22today%205-y%22%7D%5D%2C%22category%22%3A0%2C%22property%22%3A%22%22%7D&tz=-480&eq=date%3Dtoday%25205-y%26q%3Debike


